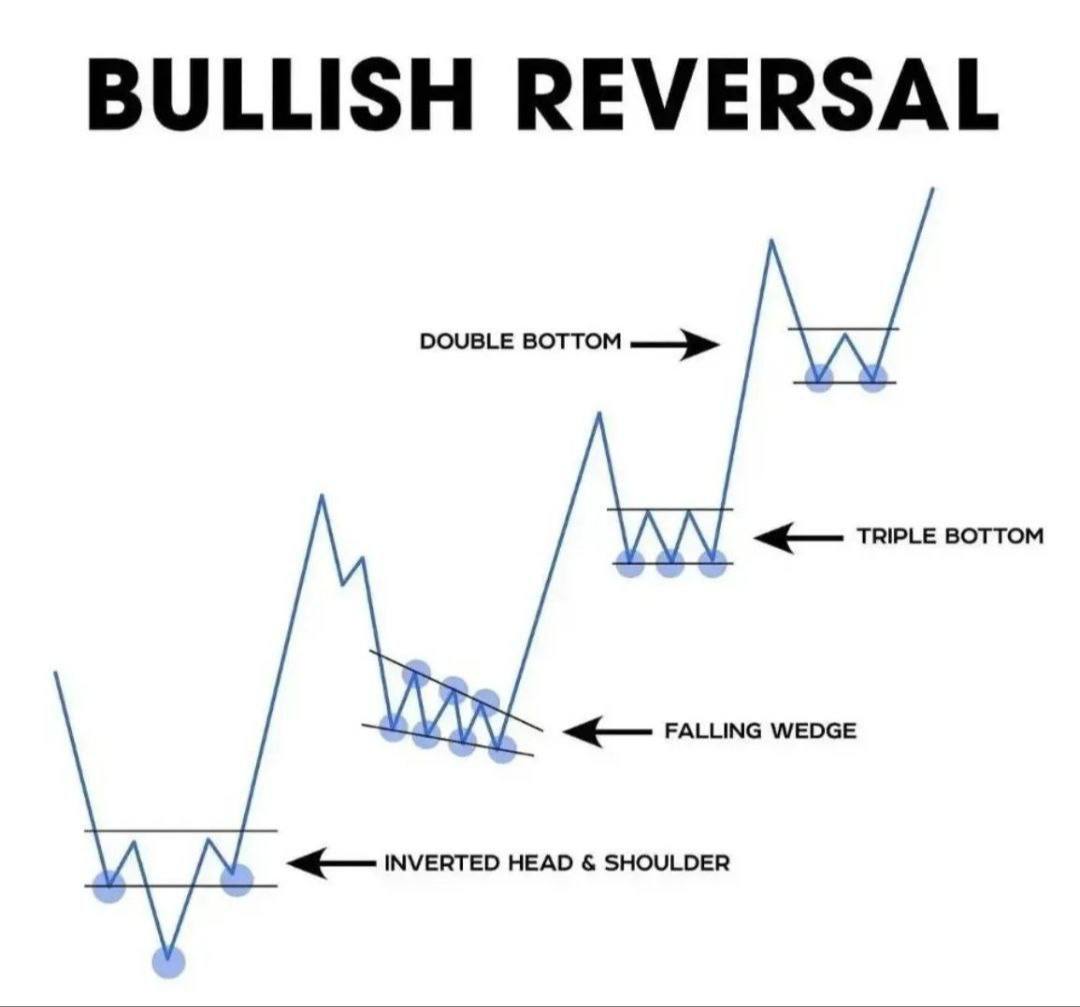
When you’re analyzing charts in the financial markets, recognizing bullish reversal patterns can be a game-changer. These patterns often signal a shift from a downtrend to an uptrend, giving traders an opportunity to capitalize on market momentum. Let’s break down the most common bullish reversal patterns to help you spot them with ease.

1🌄 Double Bottom
The double bottom is one of the simplest yet most powerful reversal patterns. Visually, it resembles a ‘W’ shape on the chart. Here’s how it works:
- The price makes a low, bounces higher, and then retests that low.
- If the second low holds and the price breaks above the resistance level formed at the previous bounce, it’s a strong sign that sellers are losing strength and buyers are stepping in.
Pro Tip: Look for confirmation with higher trading volume during the breakout!
2🌄 Triple Bottom
Similar to the double bottom, but instead of two dips, there are three. This pattern highlights:
- Three distinct troughs at roughly the same price level, signaling a strong support zone.
- Once the price breaks above the resistance formed by the peaks between the dips, buyers may take control.
Why It Matters: The triple bottom shows that the market has tested support multiple times, and the inability of sellers to push prices lower suggests an upcoming bullish breakout.
3🌄 Falling Wedge
The falling wedge is a consolidation pattern that’s easy to recognize:
- Prices form lower highs and lower lows within converging trendlines.
- As the range narrows, sellers lose momentum, and a breakout to the upside is likely.
What To Watch For: Ensure the breakout occurs with strong volume, as this validates the pattern’s reliability.
4🌄 Inverted Head & Shoulders
This pattern is as descriptive as its name suggests:
- A large dip (head) is flanked by two smaller dips (shoulders) on either side.
- The neckline (resistance level) connects the peaks of the shoulders. A break above this neckline signals that buyers are ready to take charge.
Key Feature: This pattern often occurs after a sustained downtrend, making it one of the most reliable reversal signals.
Final Thoughts
These bullish reversal patterns are powerful tools in your trading arsenal. Whether you’re a beginner or seasoned trader, learning to spot these patterns can help you anticipate market moves and trade with confidence.
Remember: Always combine these patterns with other indicators, like volume or moving averages, to improve accuracy.
So, keep an eye on your charts, study these patterns, and let the market tell you its story! 🟢


Leave a Comment